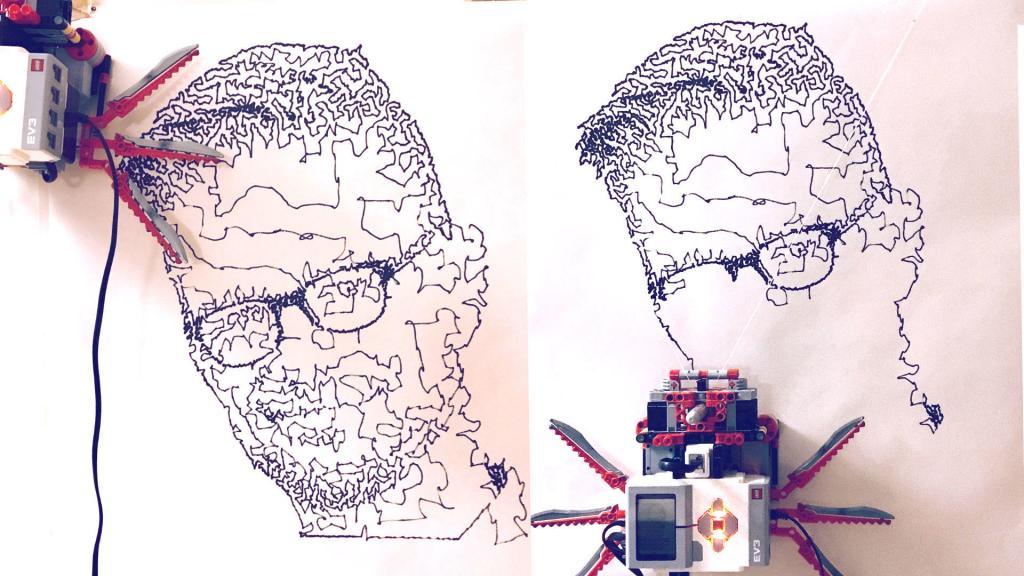
In this article I’m sharing Building instructions for making a vertical plotter with a single retail kit of LEGO MINDSTORMS EV3! The plotter is hung by two threads to a wall or door. This vertical plotter MOC is built with only a single LEGO 31313 kit. I named my plotter after the famous Belgian painter James Ensor, who was famous for drawing masks. I programmed the robot to follow a path along a list of coordinates. This way it can draw circles, squares and even complete portraits.
What you need
Other than a base LEGO MINDSTORMS kit, you need some household materials. The model is built to fit exactly to a Sharpie pen. Different pens might not fit or be too loose. Next you need some dental floss. Preferably cheap unwaxed floss. For paper I bought a 50cm wide roll. Individual sheets are possible too, but they are way more expensive and harder to store. I also bought some ECO friendly masking tape to fix the paper to the door – which of course you also need. I used a door to hang the plotter so I was able to hang it with just a loop at the end of the dental floss. You might have to get creative if you don’t have such door.
For controlling the motors and making them turn towards every position I built an ev3-g project. I did a post about the math involved. It’s easier than you’d think. I’m planning to do another post to explain how that program works.
First, here’s a quick video of the plotter in action.
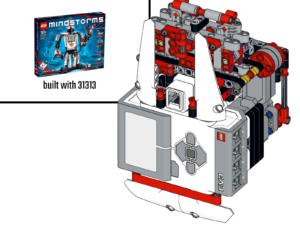
Building Instructions & EV3-G code
Generating coordinates
The hardest part of the project is actually generating coordinates for the plotter to go to. Here’s a little python script on that does just that. What I did is generate normalized coordinates. Normalized means that all values are between 0 and 1. So 0,0 is the top left corner of the plotting area and 1,1 is the bottom right corner. This way the coordinate files are independent of plotter surface size.
It would be perfectly possible to generate the coordinates without python, just in a browser with JavaScript, but my JS skills are not good enough for that. I would really appreciate it if some could help to convert my python script to JS.
Downloading the rtf files to the robot
With EV3-G plotting from a file is perfectly possible. The tricky bit is getting the coordinates on to the Ev3 Intelligent brick. Here are the steps you should take:






Really cool project! Although I want to start, it seems like the building instructions are not in order and also the post itself seems incomplete.
I do not understand the variable cm_to_angle_in_deg variable in the program. Can you help me understand it and how to calculate it, it has a default value of -158. Also where it says “horizontal distance from fixture” , fixture means from where it hangs like a nail right?
The motor has to run -158 degrees to move 1 cm down on the rope. Horizontal distance from fixture means the left margin between the left hangnail and the beginning of the drawing. See also here: https://www.antonsmindstorms.com/2018/10/27/vertical-plottor-how-to-calculate-coordinates/